The See-Saw and the Snapped Anchor
What twenty years of daily data reveal about the US dollar and the price of gold, and why the old rulebook no longer explains where gold trades.
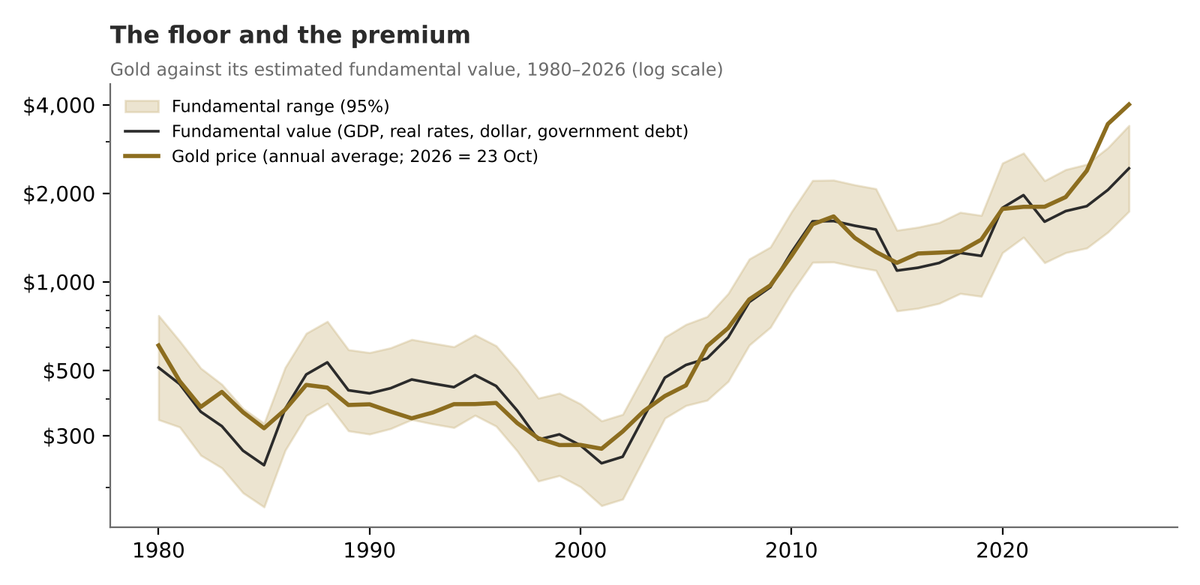
In 2026, every time the US dollar rose by 1% in a single day, the price of gold fell by almost 4%. That is nearly three times its average over the previous twenty years. And yet gold now trades at more than two and a half times the price that the dollar, interest rates and inflation say it should.
Both of those statements are true. On the face of it they contradict each other: the first says the dollar has never had a tighter grip on gold; the second says the dollar, together with its usual accomplices, has lost its grip almost entirely. Reconciling the two is the purpose of this article, and the answer turns out to be one of the more useful lessons in financial economics. A relationship can be alive and well from one day to the next while being quite dead over a span of years.
To reach that answer, Synterra ran a series of statistical tests on 5,060 trading days of market data, from January 2006 to September 2026. This article explains what we did and what we found, and it explains every technical term along the way. No prior knowledge of finance is assumed. Where a term needs more than a sentence, it is explained in a Plain English box.
1. Why should the dollar matter to gold at all?
Gold is a lump of metal. It pays no interest, issues no dividends and has no management team. So why should its price care what happens to one particular currency? There are two reasons, and both follow from the fact that gold is priced, traded and settled almost entirely in US dollars.
The first reason is arithmetic. Imagine a jeweller in Frankfurt who buys gold at $4,000 an ounce. If the dollar strengthens by 10% against the euro, that same ounce now costs her 10% more in her own currency, even though the dollar price has not moved. She buys less. So do buyers in Mumbai, Shanghai and Dubai. Lower demand pushes the dollar price of gold down until it finds a new balance. A stronger dollar therefore tends to mean cheaper gold in dollar terms, and a weaker dollar tends to mean dearer gold.
The second reason is competition. In a crisis, frightened money looks for somewhere safe to hide. The two most popular hiding places are US dollars, usually held as short-term US government debt, and gold. When the dollar becomes more attractive, typically because American interest rates rise, gold loses customers to its rival.
Put the two together and you get what traders loosely call a see-saw: when one end goes up, the other tends to go down. The question this article asks is how strong that see-saw really is, whether it has changed, and whether it still explains where gold trades.
2. Rounding up the usual suspects
The dollar does not act alone. If we simply compared gold with the dollar, we would risk crediting the dollar with work done by other forces that happen to move at the same time. It is rather like concluding that umbrellas cause traffic jams because both appear on rainy days. To isolate the dollar's own effect, we must also include the other main suspects, and hold them constant while we look at the dollar. Economists call these control variables.
| Suspect | What it measures | Why it should matter for gold | Expected effect |
|---|---|---|---|
| Real interest rate (10-year TIPS yield) | The interest an investor earns on US government debt after inflation is taken out. | Gold pays nothing. The more an investor can earn safely elsewhere, the higher the cost of holding gold. | Up = gold down |
| Inflation expectations (10-year breakeven) | The average inflation rate that bond markets expect over the next ten years. | Gold is traditionally held as protection against rising prices. | Up = gold up |
| Fear (VIX index) | Expected turbulence in the US stock market, often called the "fear gauge". | Gold is a safe haven. When investors are frightened, some buy gold. | Up = gold up |
| Oil (Brent crude) | The world benchmark price of crude oil. | Oil feeds inflation and moves with the wider commodity cycle. | Up = gold up |
Why not CPI? The Consumer Price Index (CPI) is the official measure of inflation, and an obvious candidate. The difficulty is that it is published once a month. In a daily model, CPI would appear as a flat line that steps up once every few weeks, which would tell us nothing about why gold moved on a Tuesday afternoon. It would be like checking a monthly bank statement to discover what you spent this morning. For the daily analysis we therefore use breakeven inflation, which the bond market updates every second of the trading day. CPI comes into its own in the long-run monthly analysis in Section 8.
3. How we tested it, without the jargon
Our data run from 3 January 2006 to 18 September 2026, the last trading day before our 20 September cut-off. That gives 5,060 trading days, 176 of them in 2026. The start date is set by the Federal Reserve's broad dollar index, which begins in 2006. The period is long enough to include the global financial crisis of 2008, the gold boom of 2011, the crash of 2013, the pandemic and the extraordinary rally of 2022 to 2026. The gold price is the New York close of COMEX gold futures; the other series come from the Federal Reserve Bank of St. Louis. The method had five steps.
Step 1: compare daily changes, not prices
Gold has risen from about $530 to over $4,400 since 2006. So have house prices, CPI and the number of people who own a smartphone. Anything that trends upwards will appear related to anything else that trends upwards, whether or not there is any connection. Statisticians call this a spurious regression. To avoid the trap, we test whether each series "wanders" (it does) and then work with daily percentage changes, which do not.
Step 2: run a regression
A regression is a statistical machine for separating ingredients. Feed it gold's daily moves alongside the moves in the dollar, real rates, inflation expectations, fear and oil, and it estimates how much of gold's movement belongs to each, holding the others fixed. The number attached to the dollar is called its beta: the percentage change in gold associated with a 1% change in the dollar.
Step 3: allow for calm and storms
Markets have weather. Calm days follow calm days, and storms come in clusters. An ordinary regression assumes the weather is always the same, which makes it overconfident during storms. A GARCH model fixes this by letting the expected size of gold's daily moves rise and fall over time. We ran every important test both ways.
Step 4: look for change
We measured the dollar effect in rolling one-year windows to see how it evolved, and we ran a structural break test that searches the data for the dates on which the relationship changed, without being told where to look.
Step 5: test the long run
Finally, we switched to monthly data, added CPI, and asked a different question: not "does gold move when the dollar moves?" but "do gold, the dollar, real rates and prices stay bound together over the years?" This uses a technique called ARDL and a concept called cointegration, both explained in Section 8.
4. Finding one: the see-saw is real
Across twenty years, the dollar beta is −1.35, with a t-statistic of −15.7. In plain terms: on a day when the dollar rises by 1%, gold falls by about 1.35%, and the probability that this pattern is a statistical accident is vanishingly small. The GARCH version, which allows for market storms, gives almost the same answer: −1.33.
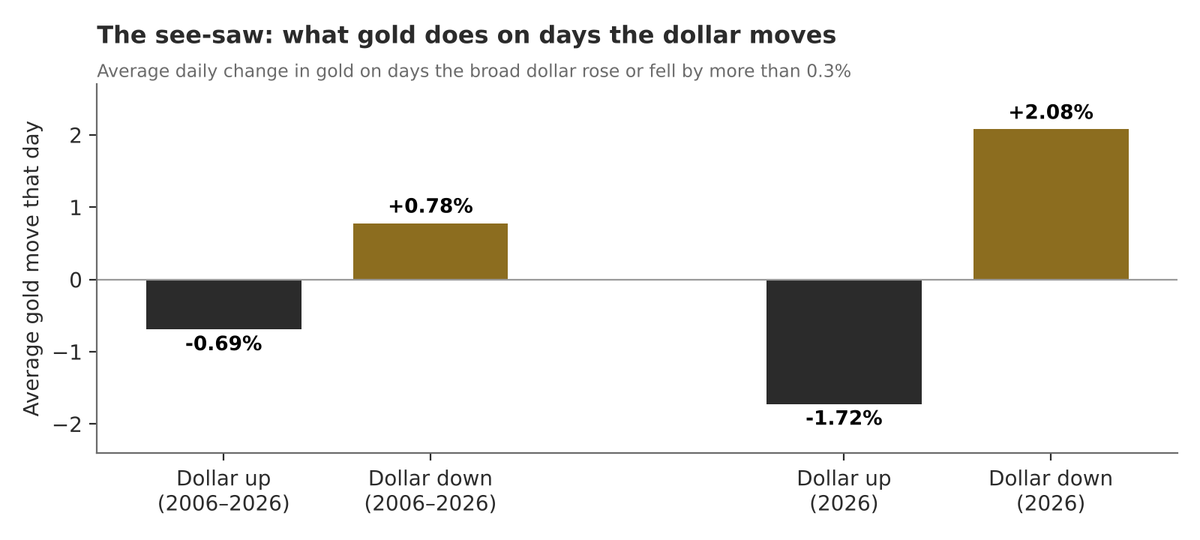
Figure 1 shows the see-saw in its simplest form. On days when the dollar rose by more than 0.3%, gold fell by an average of 0.69%, and it fell on 73% of those days. On days when the dollar fell by more than 0.3%, gold rose by an average of 0.78%, and it rose on 80% of them. Across all days, gold moved in the opposite direction to the dollar two times out of three.
A word of humility is in order. The model's R² is 0.19, so the dollar and the four other suspects together explain about a fifth of gold's daily movement. The dollar alone explains 16%. The other four-fifths is everything else: news, speculative flows, physical buying in Asia, central-bank purchases and the general mood of the market. The dollar is the single most important daily influence we can measure, but it is very far from the whole story.
The other suspects behave broadly as theory predicts. A 25 basis point rise in real interest rates is associated with a fall in gold of a little under 1%. Fear and oil both push gold up. The one surprise is inflation expectations, which carry a small negative sign. The reason is that, with real rates held constant, a rise in breakeven inflation is mechanically a rise in the headline interest rate, and gold dislikes higher interest rates of any kind. The effect is small and disappears after 2022.
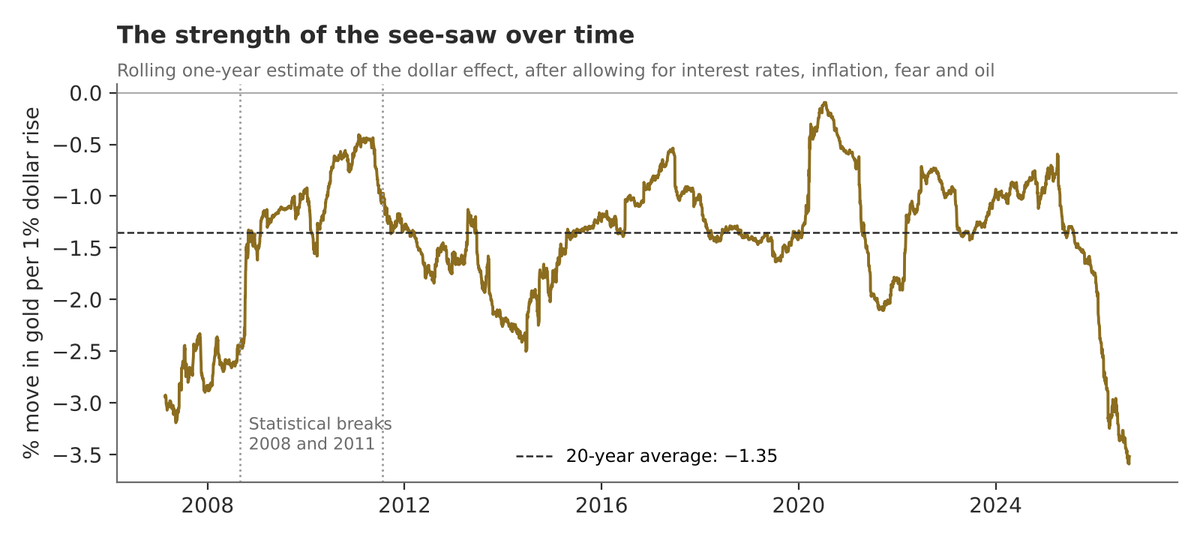
Crucially, the dollar effect is stable. Split the twenty years into periods and the beta barely changes, until 2026.
| Period | Dollar beta | t-statistic | Share of gold's daily moves explained (R²) |
|---|---|---|---|
| 2006–2012 | −1.31 | −9.1 | 19% |
| 2013–2019 | −1.29 | −10.9 | 27% |
| 2020–2021 | −0.98 | −3.2 | 18% |
| 2022–2025 | −1.12 | −7.2 | 24% |
| 2026 to date | −3.83 | −7.2 | 31% |
| Full sample, 2006–2026 | −1.35 | −15.7 | 19% |
5. Finding two: 2026 was louder, not different
At first sight, 2026 is extraordinary. The dollar beta jumps to −3.83, nearly three times its long-run average, and a formal test confirms that the 2026 figure is statistically different from 2022–2025. A casual reader might conclude that the dollar has seized control of gold. That conclusion would be wrong, and the reason is instructive.
A beta measures the size of gold's moves relative to the dollar's. It can rise for two quite different reasons: because gold follows the dollar more faithfully, or because gold simply moves more violently in general. In 2026, it was mostly the second. Gold's annualised volatility, a measure of how wildly a price swings, reached about 31%, the highest in our sample and edging past even 2008. Its average daily move was 1.4%, against 0.8% over the previous twenty years. Gold moved by more than 3% in a single day on 15 occasions in 2026, compared with an average of about six a year before. On 30 January, the day after gold's record close of about $5,318, COMEX gold fell almost 11% in a single session.
Meanwhile, the dollar was, if anything, calmer than usual. The correlation between the two, which measures how reliably they move in opposite directions regardless of size, was −0.54 in 2026. That is a little tighter than the twenty-year average of −0.40, but well within the range seen in earlier years: 2007 and 2018 were both tighter still. When we break the 2026 increase in beta into its two parts, roughly 70% comes from gold's higher volatility and only 30% from a tighter link. The song has not changed. Someone has turned up the volume.
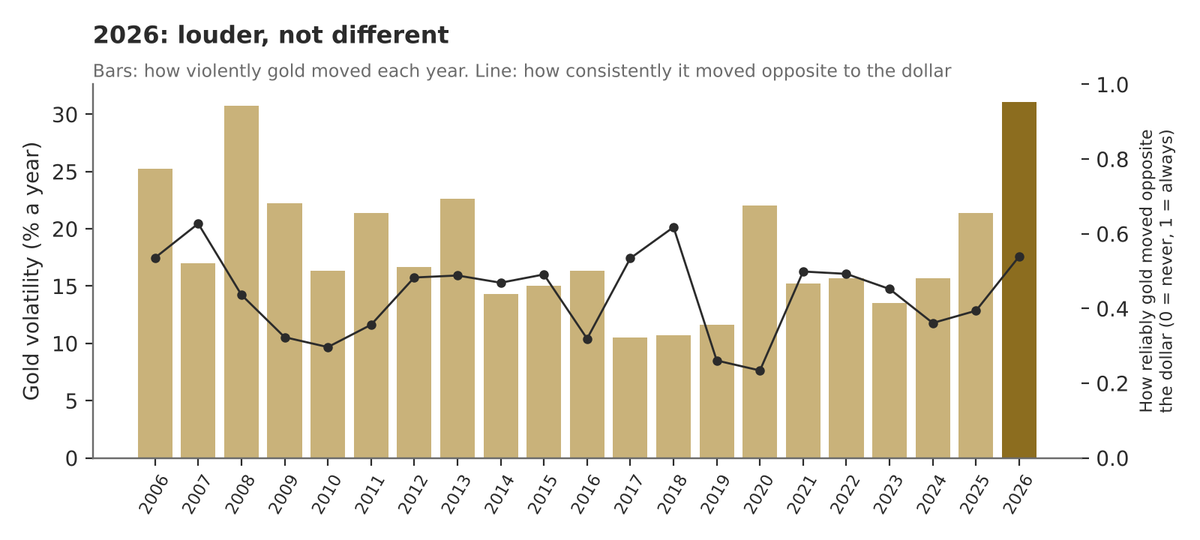
Two caveats apply. First, 176 trading days is a short sample, and the 2026 estimate is far less precise than the twenty-year figure. Second, when we use two-day rather than one-day changes, the 2026 beta falls to about −2.8, which suggests that some of gold's same-day reactions in 2026 were overreactions that partly reversed the following day.
6. Finding three: no grudges and no delays
Two further questions are worth asking. Does gold respond more strongly to a rising dollar than to a falling one? And does gold react with a delay, giving an alert investor time to act?
The answer to both is no. Splitting dollar moves into rises and falls produces almost identical betas over the full sample, −1.35 and −1.36, and the difference is statistically meaningless. In 2026 the gap is wider, −4.3 against −3.4, but it is still well within the range of chance. Gold holds no grudges: it responds to the dollar symmetrically. Nor does yesterday's dollar move help explain today's gold price. The reaction is complete within the same trading day.
This matters because it tells us that the market is doing its job. Information about the dollar is absorbed into the gold price within hours. There is no simple trading rule here of the "buy gold the morning after the dollar falls" variety. Anyone who claims otherwise should be asked for their data.
7. Finding four: when the see-saw changed
A popular story holds that the gold–dollar relationship "broke" in 2022, when central banks began buying gold on an unprecedented scale. We tested that story directly. A structural break test, specifically the Bai–Perron method, searches every possible combination of dates for the points at which the relationship shifted, and it is not told where to look.
It found two breaks, and neither is in 2022. The first falls in late summer 2008, on the eve of the Lehman Brothers collapse; the second in July 2011, as gold raced towards what was then a record high. Before August 2008, the dollar beta was a steep −2.7. Through the crisis years it weakened to about −1.0. Since mid-2011 it has settled at about −1.3, and it held there through 2022, 2023, 2024 and 2025. The test works on a monthly grid, so the dates are accurate to within a few weeks.
So at the daily level, the see-saw did not break in 2022. Day to day, the dollar went on pushing gold around exactly as before. Something did break in 2022, but to see it we need a different lens.
8. Finding five: the anchor that snapped
Everything so far concerns daily movements. A quite different question is whether gold, the dollar, real interest rates and the price level are tied together over the long run, so that if gold drifts too far from where they say it should be, it is eventually pulled back.
We built a monthly model covering 248 months from January 2006 to September 2026, linking the gold price to the dollar, real interest rates and CPI. Over the full period, the lead appears to have been cut. The formal test is borderline, but the error-correction term is close to zero (about 1% a month, implying it would take around five years to close even half of any gap) and is statistically indistinguishable from zero. A second standard test, the Engle–Granger method, also fails to find a stable long-run relationship.
The story becomes vivid when we estimate the long-run rulebook using only the years before 2022. That rulebook says that a 1% stronger dollar means about 1.2% cheaper gold; a one percentage point rise in real interest rates means gold about 18% cheaper; and a 1% higher price level means gold about 2.3% dearer. For sixteen years it worked remarkably well. In 98% of the months from 2006 to 2021, gold stayed within 20% of the rulebook value, and on average it was within 8%.
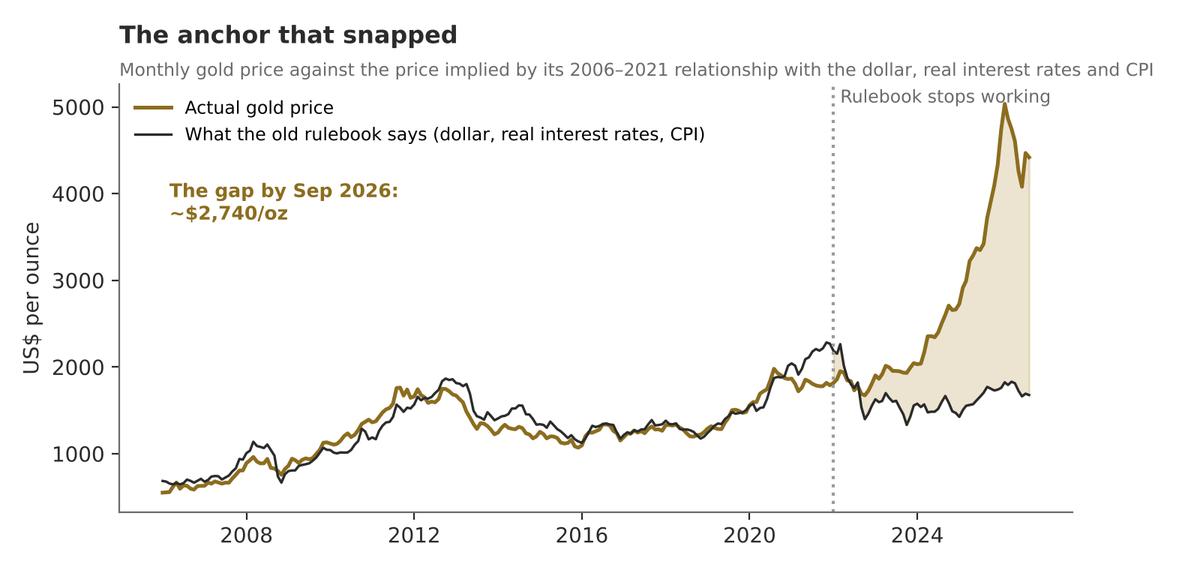
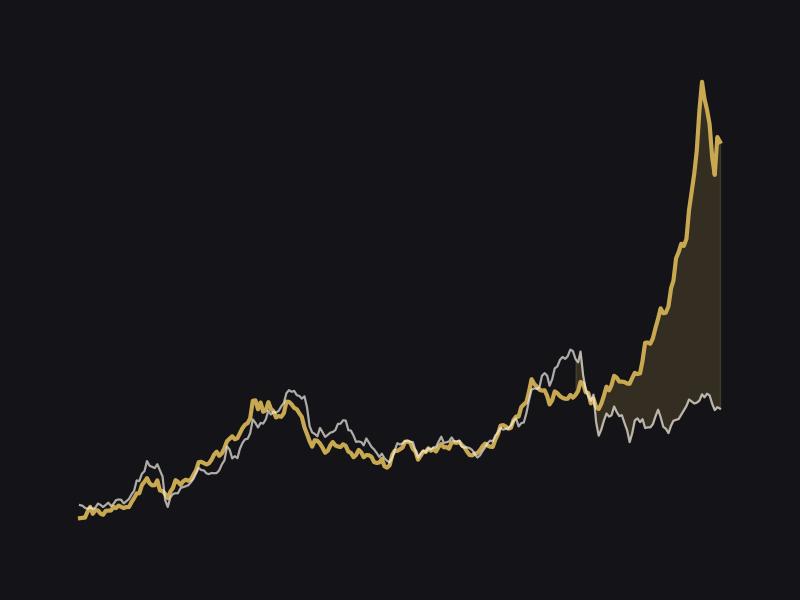
Then it stopped working. Between 2021 and 2026, average real interest rates rose from about −0.9% to about +2.1%, and the broad dollar strengthened by about 5%. By the old rulebook, that is a near-perfect recipe for falling gold. Instead, gold climbed from about $1,790 in December 2021 to about $4,420 in September 2026. The rulebook value for September 2026 is about $1,680. The gap is roughly $2,740 an ounce: gold trades at about 2.6 times what the old relationship says it should.
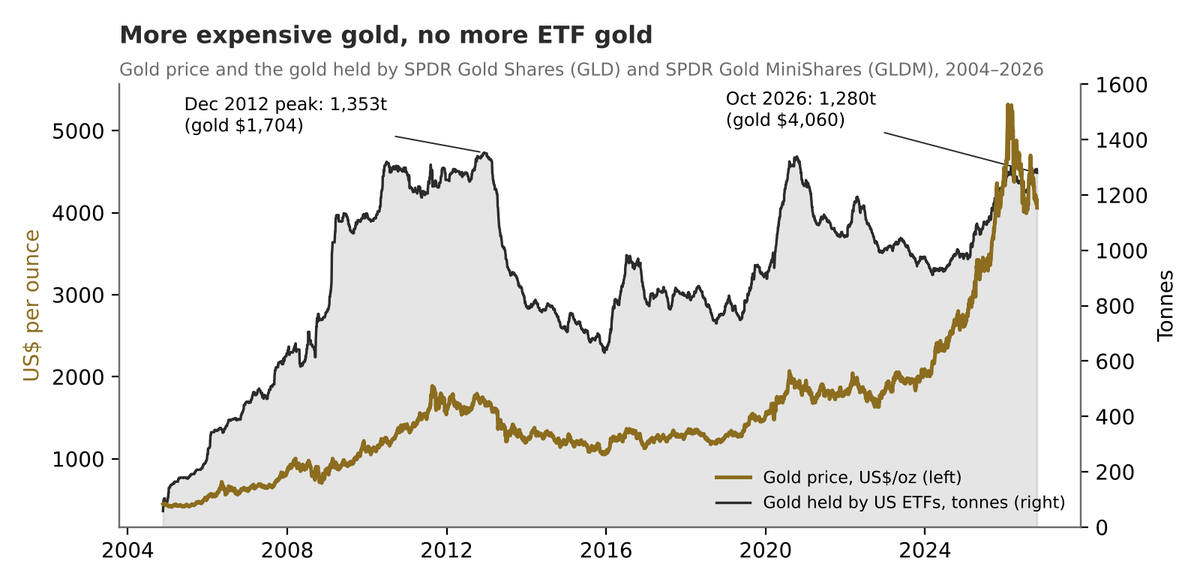
Our model cannot tell us what filled that gap, because whatever it is does not appear in our data. The most plausible candidate, which Synterra discussed in its October 2026 Investor Note, is official-sector demand. Central banks bought more than 1,000 tonnes of gold in each of 2022, 2023 and 2024, roughly double their 2010–2021 average, after the freezing of Russia's foreign-exchange reserves in 2022 reminded every finance ministry that a dollar reserve is only as safe as America's goodwill. These buyers do not care about the yield on Treasury bonds. They care about who can freeze their savings. A model built on yields and exchange rates is blind to them by construction.
One caution is essential. The gap is not a forecast. It does not mean gold "should" fall to $1,680, and the statistical tests are clear that the old rulebook no longer binds. It is at least as likely that the rulebook is obsolete as that gold is overvalued. What the gap does measure is how much of today's gold price rests on forces other than the dollar, interest rates and inflation, and therefore how exposed the price would be if those forces faded.
9. Why this matters
For students of economics
There are two lessons here that extend well beyond gold. The first is that a relationship in changes and a relationship in levels are different questions. The dollar and gold can move against each other faithfully every day while drifting apart over years, much as two passengers on the same train can jostle each other at every bend while the train carries both somewhere neither expected. The second is that every statistical model is a rulebook written from the past. When the identity of the marginal buyer changes, the rulebook can fail without warning, even while each individual day still looks normal.
For investors
The dollar remains a useful guide to gold's short-term risk. An investor hedging a gold position over days or weeks can rely on the see-saw. As a guide to value, however, the dollar is now close to useless. The level of gold depends on whether sovereign buyers keep buying. If they slow, the forces our model can see would reassert themselves, and those forces currently point a long way down.
For Synterra
Price decks, not spot. Synterra values tailings and brownfield projects on conservative gold price assumptions rather than the spot price. This analysis reinforces that discipline. The rulebook value is a useful extreme downside case for stress-testing project economics and debt sizing.
Confidence in in-situ gold. For SYNTGOLD and any instrument offering economic rights to unmined gold, the question investors will ask is what supports the price. If the answer is sovereign demand rather than rates, then independent verification, proof of reserves and conservative reserve haircuts matter more, not less.
Signposts. The variables worth watching are central-bank purchase data, ETF flows and real interest rates. A slowdown in official buying combined with high real rates would be the scenario in which the gap begins to close.
10. Health warnings
Good analysis states its own limits. Five apply here.
Correlation is not causation. The dollar and gold often react to the same piece of news, such as a strong US jobs report. Our betas measure how they move together, not proof that one drives the other.
2026 is nine months. Conclusions about 2026 rest on 176 trading days and are far less certain than the twenty-year results.
Timing. The Federal Reserve's dollar index is measured at noon in New York, while gold and bond prices close later in the day. We checked with two-day changes, which confirm the main results.
The missing suspect. Central-bank and ETF demand is not available daily, so it sits outside the model. That is precisely why the long-run gap appears.
Rulebooks change. The relationship has shifted before, in 2008 and 2011, and will shift again.
11. Conclusion
The US dollar has not lost its influence over gold. Day by day, it remains the single most powerful force we can measure, and in 2026 its effect, amplified by extraordinary volatility, was the strongest in two decades. But influence over the next move is not the same as authority over the price. Since 2022, the dollar, interest rates and inflation have set the rhythm of gold while something else has set the level. For those who value gold, and for those of us who dig it out of old mine dumps for a living, the most important number in this study is not the beta of −1.35. It is the gap of $2,740.
Jargon buster
| Term | Meaning |
|---|---|
| ARDL model | A model that tests whether several prices are tied together over the long run, and how quickly they correct after drifting apart. |
| Basis point (bp) | One-hundredth of a percentage point. 100bp = 1%. |
| Beta | How much one price moves, in percentage terms, for a 1% move in another. |
| Breakeven inflation | The inflation rate the bond market expects, equal to the ordinary bond yield minus the TIPS yield. |
| Broad dollar index | The Federal Reserve's measure of the dollar against the currencies of America's trading partners, weighted by trade. |
| Cointegration | A long-run bond between prices that keeps them from drifting apart for good: the walker and his dog. |
| Control variable | A factor held constant so that the effect of the variable of interest can be isolated. |
| Correlation | How consistently two things move together, from −1 (always opposite) to +1 (always together). |
| GARCH | A model that allows the size of daily price swings to rise and fall over time, so that calm and storms are treated differently. |
| R² | The share of movement a model explains, from 0 to 1. |
| Real interest rate | The interest rate after inflation is taken out. |
| Regression | A statistical method for estimating how much each of several factors contributes to an outcome. |
| Structural break | A date at which the rules of a relationship change. |
| t-statistic | A signal-to-noise ratio. Beyond ±2 suggests a result is unlikely to be chance. |
| TIPS | US government bonds whose payments rise with inflation. |
| VIX | An index of expected US stock market turbulence; the market's "fear gauge". |
| Volatility | How violently a price swings, usually expressed as an annual percentage. |
Methodology and sources
Daily data: COMEX gold front-month futures, New York close (Yahoo Finance, GC=F); Federal Reserve broad trade-weighted dollar index (DTWEXBGS); 10-year TIPS yield (DFII10); 10-year breakeven (T10YIE); VIX (VIXCLS); Brent crude (DCOILBRENTEU); all from FRED, Federal Reserve Bank of St. Louis. Monthly: CPI-U, seasonally adjusted (CPIAUCSL). Daily model: OLS on log changes with Newey–West standard errors, and GJR-GARCH(1,1) with Student-t errors. Robustness: DXY, 5y5y forward inflation, two-day returns, lags, asymmetric dollar terms, 2010–2026 sample. Breaks: Bai–Perron global search, minimum segment 10%, BIC selection. Long run: ARDL bounds test (Pesaran, Shin and Smith, case III), NARDL, Engle–Granger and dynamic OLS. Central-bank purchase figures are from the Synterra Investor Note of 19 October 2026 and were not re-estimated here. The full results workbook and code are available on request.